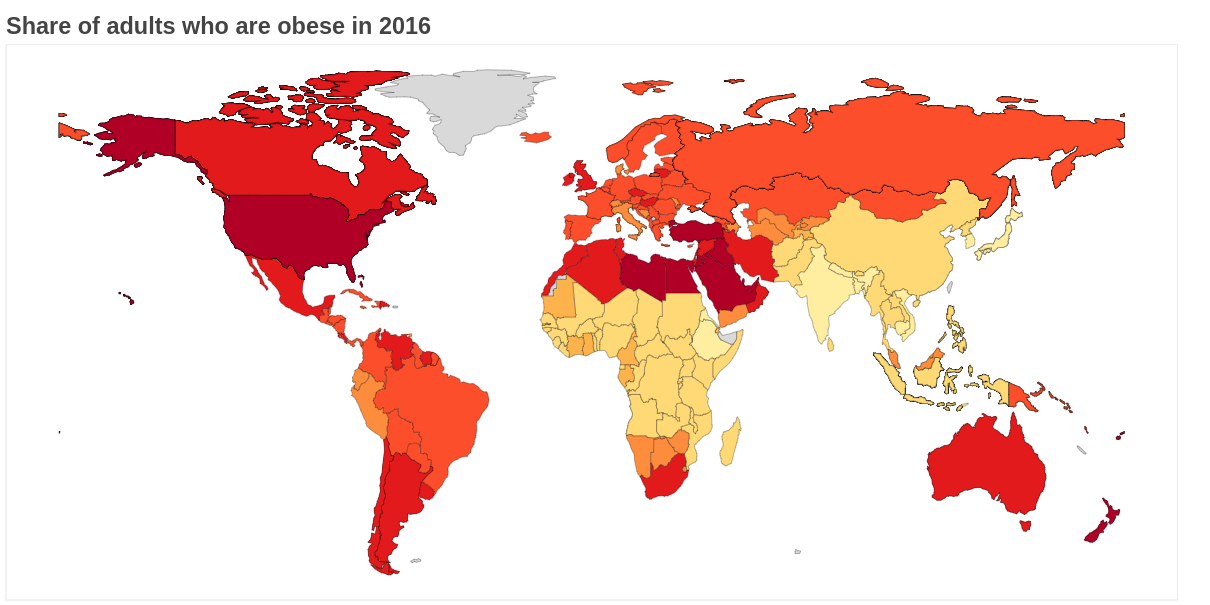
This is an advanced guide to make interactive and animated choropleth maps with Python and the Bokeh library. If you are not familiar with bokeh, please start with their simple tutorials here.
To recreate the map you will need the following python packages:
- pandas
- geopandas
- bokeh
- matplotlib
The resulting map is a standalone HTML file that you can display on your website or during presentations:
To download it: Right-click > Save link as here
You can download my jupyter-notebook with instructions here.
Of course, you can use the same code for any other endpoint. I made a simple reusable function for this in here. Just make sure the dataframe has the same format as the one we used so far, and the column with the numerical value is called “Value” (instead of “Prevalence”). Here is an example using the alcohol consumption per capita.
Cedric